Documentation
Interface Tour
This guide provides a detailed walkthrough of Sirius Scan's interface, helping you understand each component and its capabilities. After completing initial setup, use this guide to explore the full functionality of Sirius Scan.
Dashboard Overview
The Dashboard serves as your central command center, providing real-time insights into your security posture. Here you'll find an intuitive interface displaying active scans, recent discoveries, and system health metrics. The dashboard is designed to give you immediate visibility into your security status and quick access to essential functions.
- Real-time scanning activity and progress
- Latest vulnerability discoveries and trends
- System performance and health indicators
- Quick-access controls for common actions
- Overview of critical security metrics
System Monitoring Dashboard
The System Monitoring Dashboard provides comprehensive observability into the health and performance of your Sirius Scan deployment. Accessible at /system-monitor, this interface is essential for maintaining optimal system operation and quickly identifying issues.
Real-time Health Monitoring
Monitor the status of all microservices in real-time:
- sirius-ui: Web interface health and availability
- sirius-api: Backend API service status
- sirius-engine: Scanning engine operational state
- sirius-postgres: Database connectivity and health
- sirius-valkey: Cache layer performance
- sirius-rabbitmq: Message queue status and throughput
Centralized Logging
Access unified logs from all services in one location:
- Filter logs by service, severity, and time range
- Search through log entries with advanced filtering
- Export logs for external analysis
- Real-time log streaming with automatic updates
- Historical log retention and management
Performance Metrics
Track container resource utilization and system performance:
- CPU Usage: Monitor processor utilization across containers
- Memory Consumption: Track RAM usage and identify memory leaks
- Disk I/O: Monitor storage performance and capacity
- Network Traffic: Track bandwidth usage and connection patterns
- Response Times: Monitor API and service latency
- Resource Trends: View historical performance data
Key Features
- Automatic log retention policies (7 days for logs, 24 hours for metrics)
- Efficient pagination for large datasets
- Real-time updates with optimized polling
- Advanced filtering and search capabilities
- Export functionality for external monitoring tools
- Performance optimization for minimal system impact
Scanning Interface
The Scan page is the heart of Sirius Scan's functionality, where you have complete control over vulnerability assessments. This interface lets you initiate and monitor scans, tune scan strategy, and review host and vulnerability outcomes in one place. You can view real-time progress, adjust scan intensity, and run profile-based workflows from a centralized operator view.
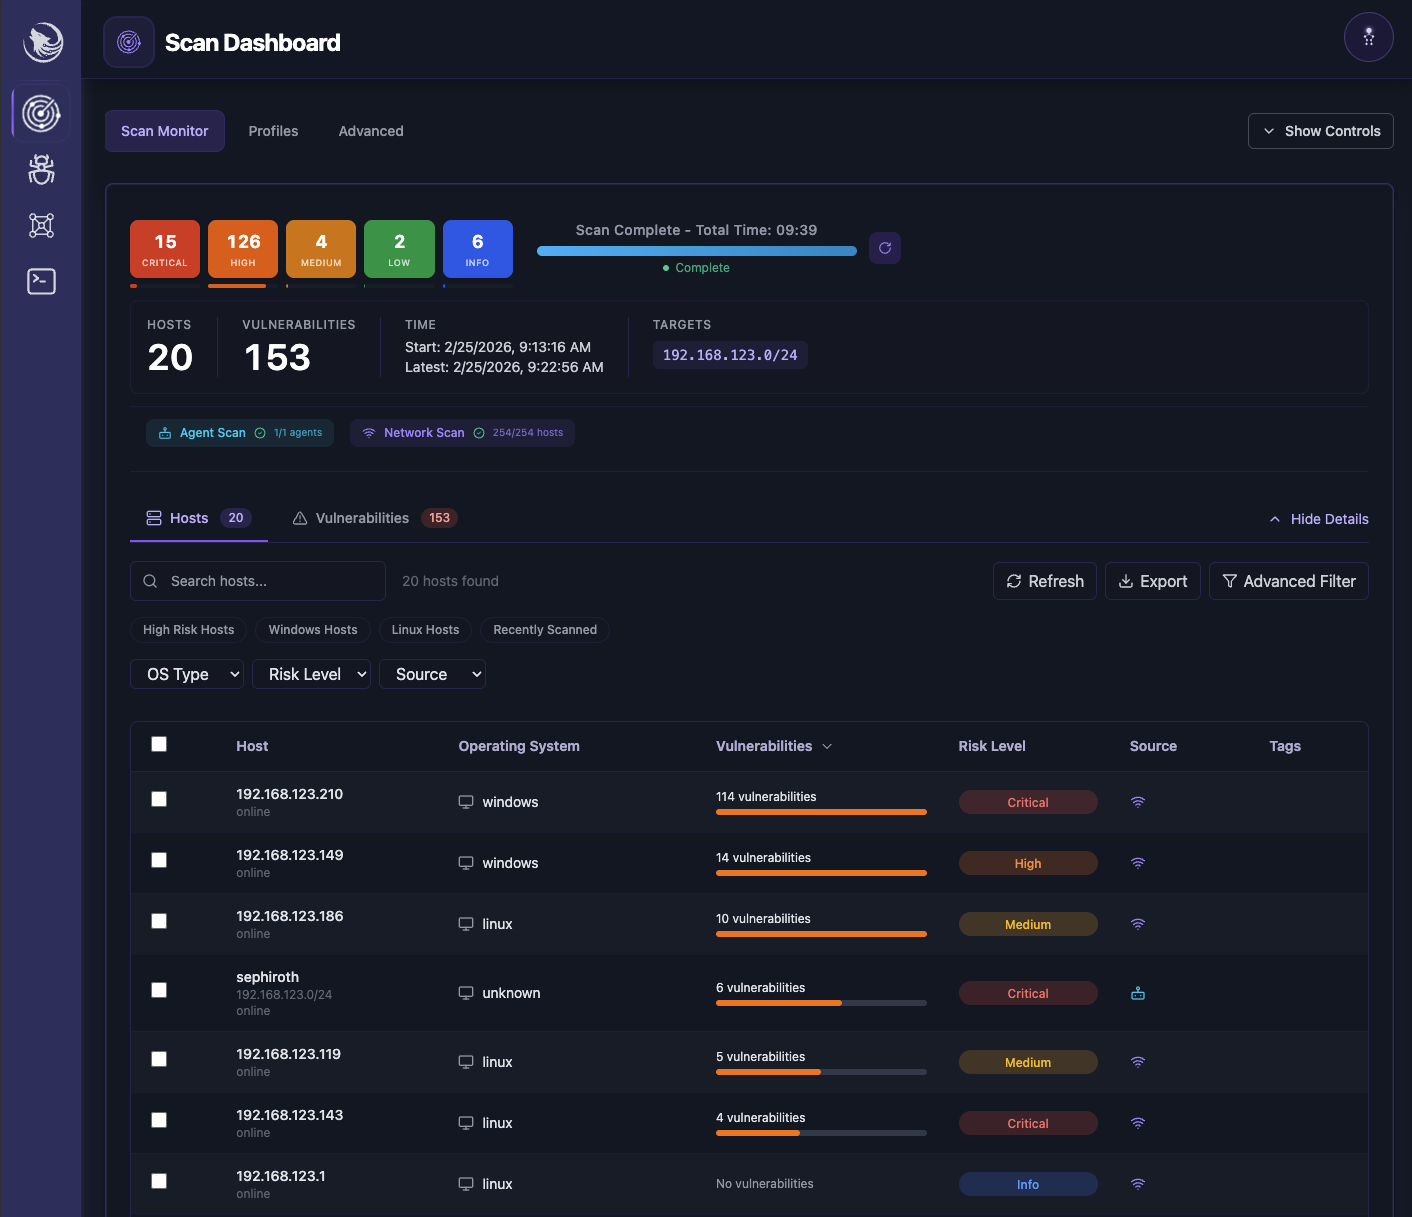
Basic Scan Controls
- Start/stop scans with a single click
- Monitor real-time scan progress and findings
- View detailed scan logs and status updates
- Pause and resume scan operations
- Quick access to common scan configurations
Advanced Configuration
- Fine-tune scanning parameters for optimal performance
- Create and save custom scan profiles
- Configure target scope and exclusions
- Set up automated scanning schedules
- Adjust resource utilization and scan intensity
Scan Profiles and Workflow Control
- Select scan profiles for quick, standard, and broad assessments
- Configure target scope and exclusions
- Manage agent and network scan visibility in one workflow
- Export results directly from scan views
- Track completion and historical runs for repeatability
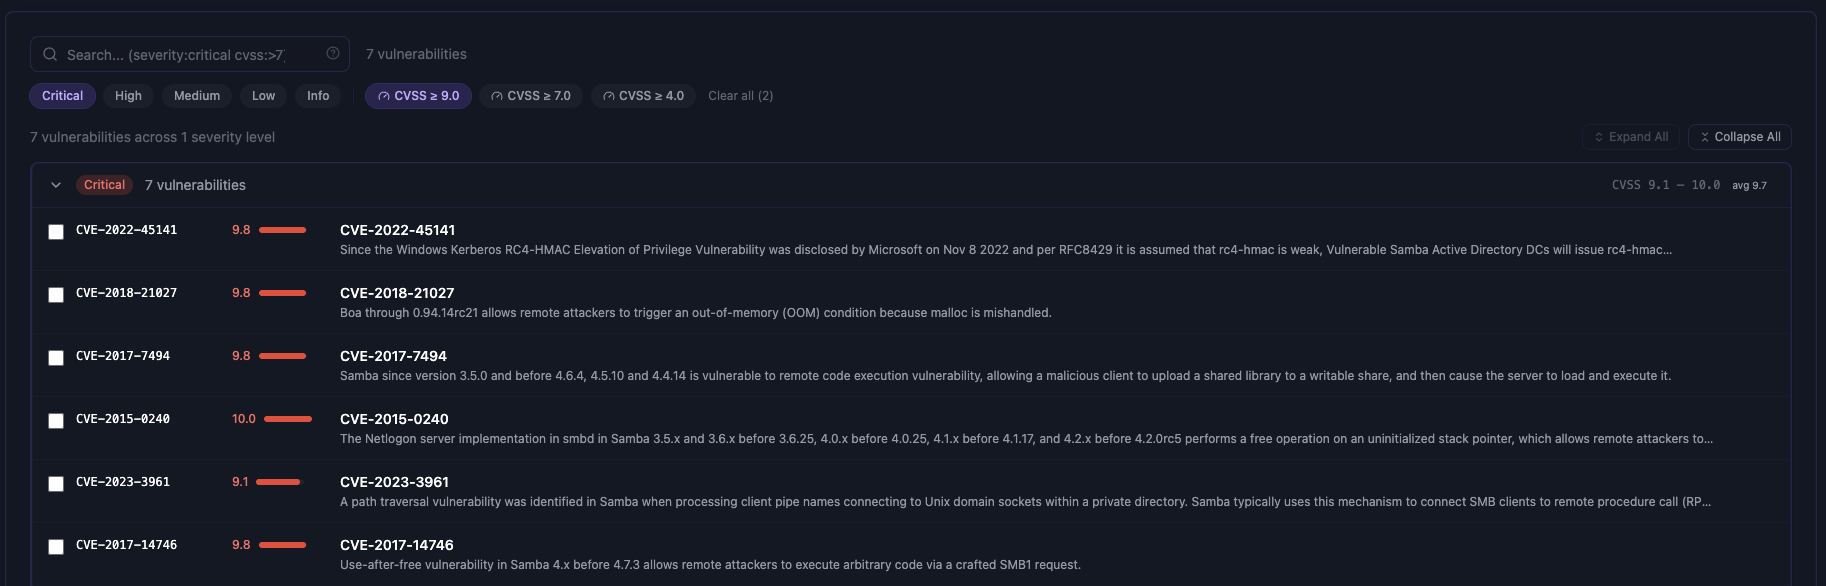
Vulnerability Navigator
The Vulnerability Navigator is your comprehensive platform for managing discovered vulnerabilities across your environment. This powerful interface aggregates all findings and provides multiple ways to view, sort, and analyze vulnerabilities. With advanced search capabilities and flexible viewing options, you can quickly identify critical issues and track remediation progress. The interface supports various visualization methods to help you understand your security posture from different perspectives.
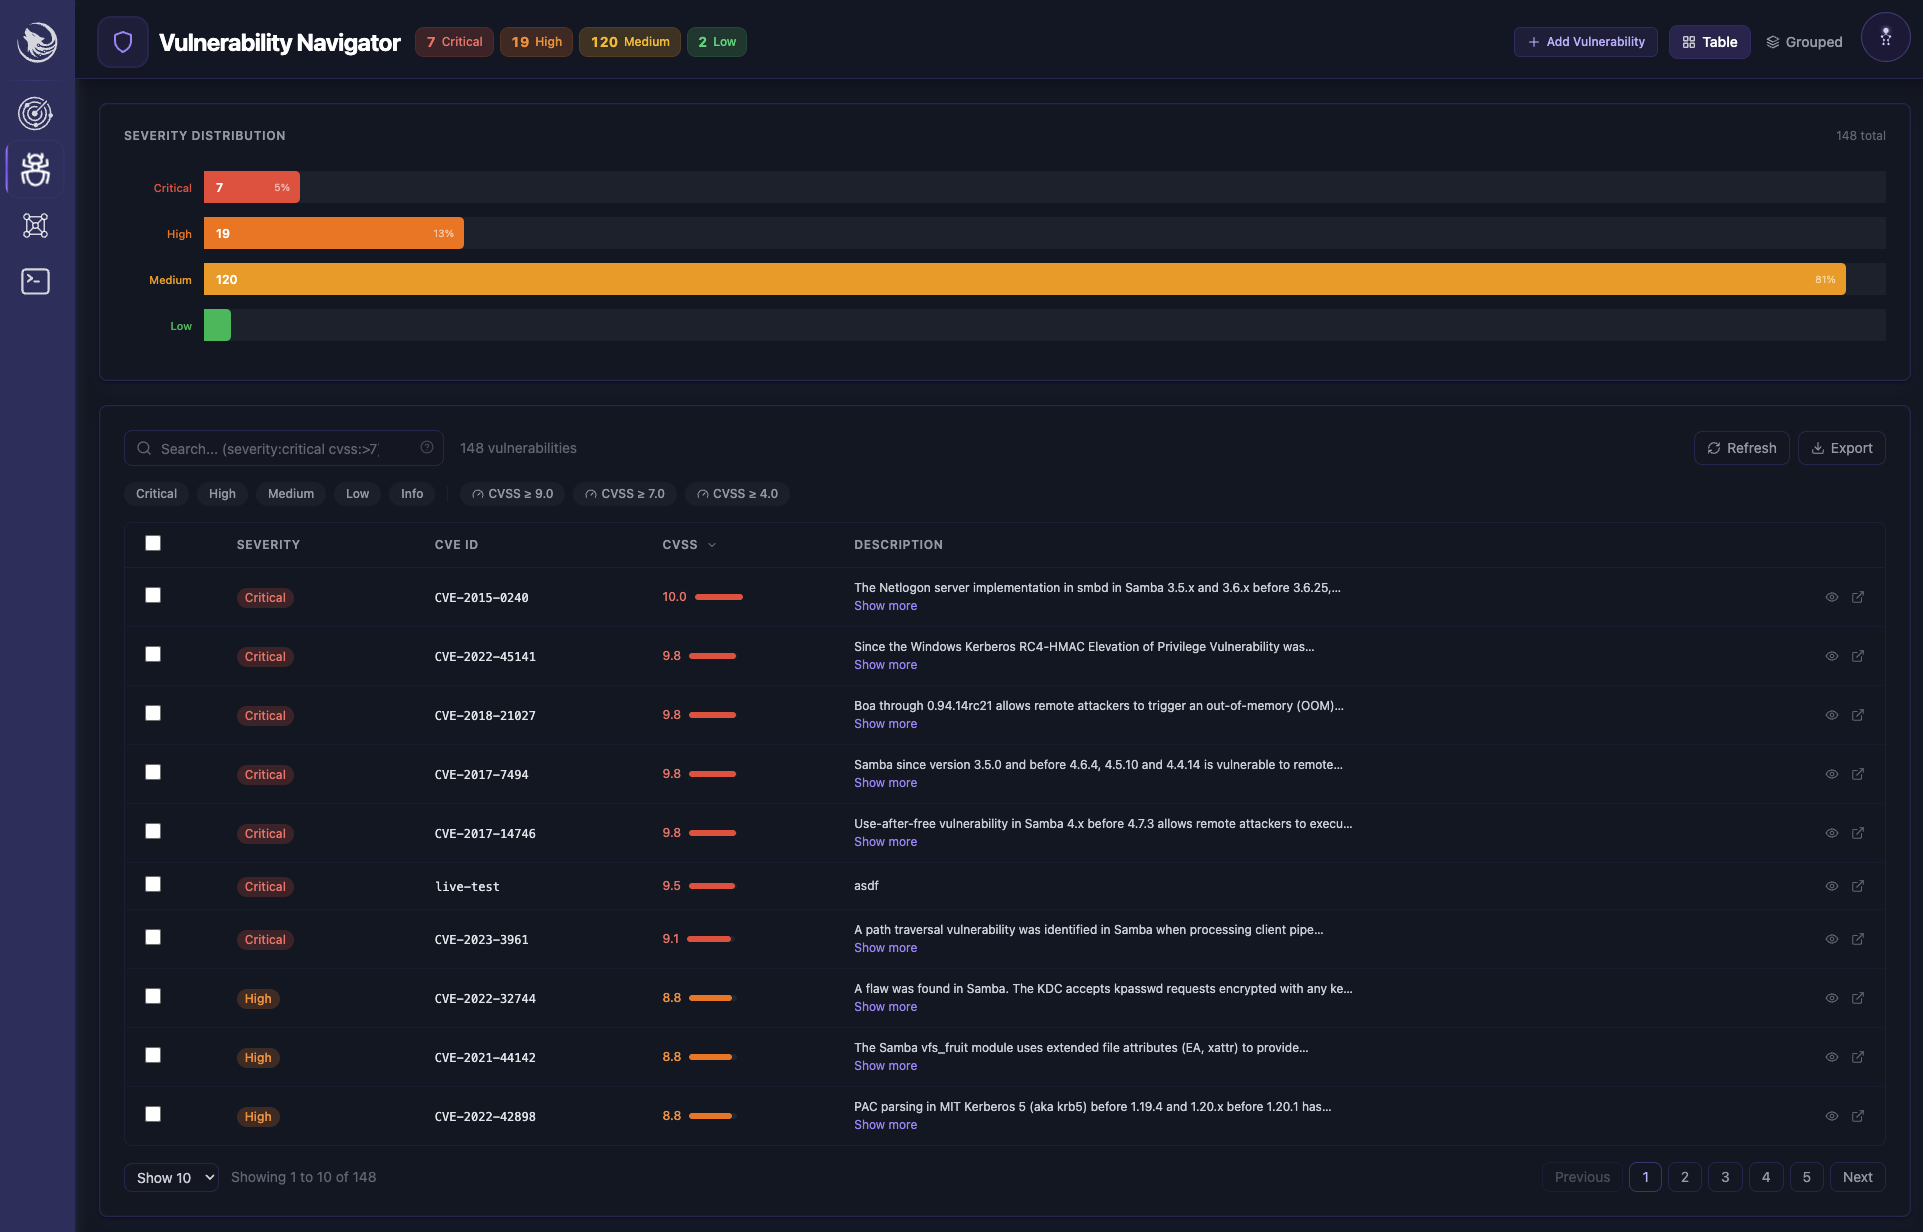
Key Features
- Dynamic vulnerability listing with real-time updates
- Advanced search with multiple filtering options
- Customizable views (list, grid, severity-based grouping)
- Bulk actions for efficient vulnerability management
- Detailed sorting and categorization options
- Export capabilities for reporting and analysis
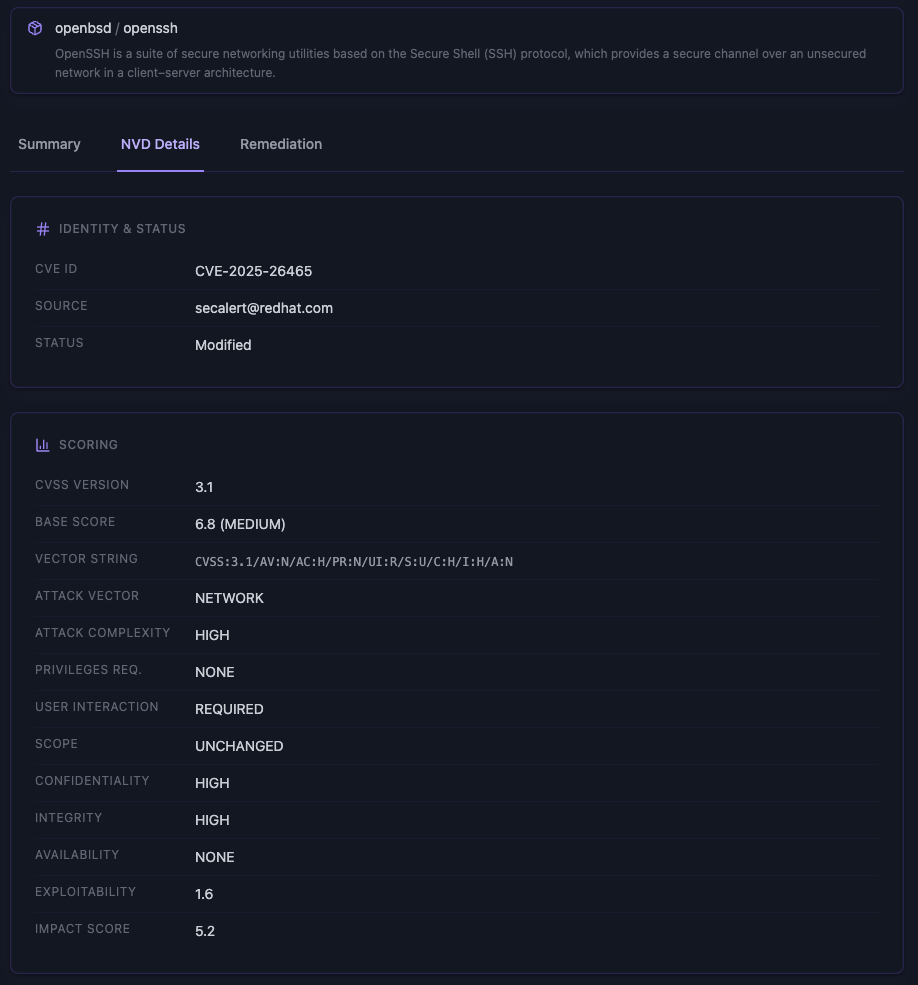
Vulnerability Reports
When you select a specific vulnerability, you'll access a detailed report that provides comprehensive information about the security issue. These reports are designed to give you all the information needed for understanding, validating, and remediating the vulnerability. Each report includes technical details, impact assessment, and actionable remediation steps.
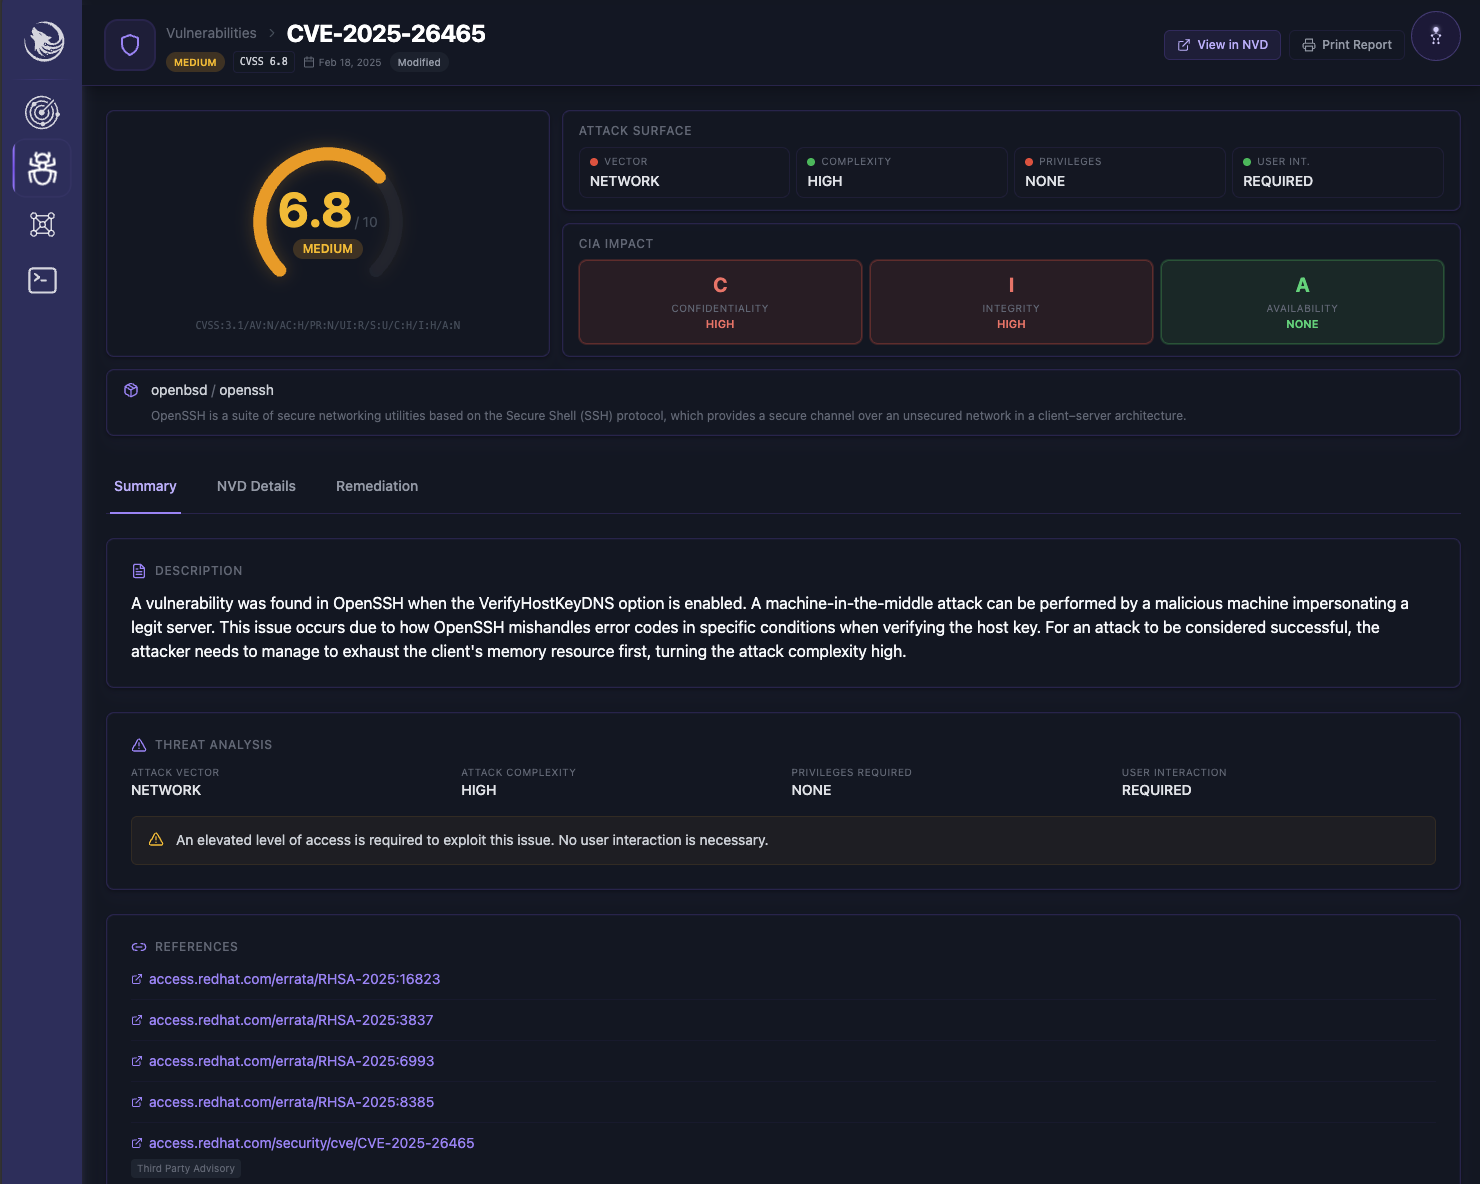
- Detailed CVE/CPE identification and mapping
- Complete CVSS scoring breakdown and risk assessment
- Affected systems and components
- Step-by-step remediation instructions
- Technical proof of concept details
- Historical context and discovery information
- Related vulnerabilities and dependencies
Grouped Triage View
Sirius Scan also supports grouped triage views for faster investigation during high-volume assessments.
NVD Detail Context
The NVD details tab provides deeper scoring context and source metadata directly inside the vulnerability workflow.
Environment Overview
The Environment page provides a comprehensive view of your infrastructure security landscape. This interface gives you visibility into all discovered hosts, their security status, and associated risks. You can quickly identify high-risk assets, track security metrics across your environment, and monitor the overall health of your infrastructure. The interface includes both high-level overviews and detailed drill-down capabilities.
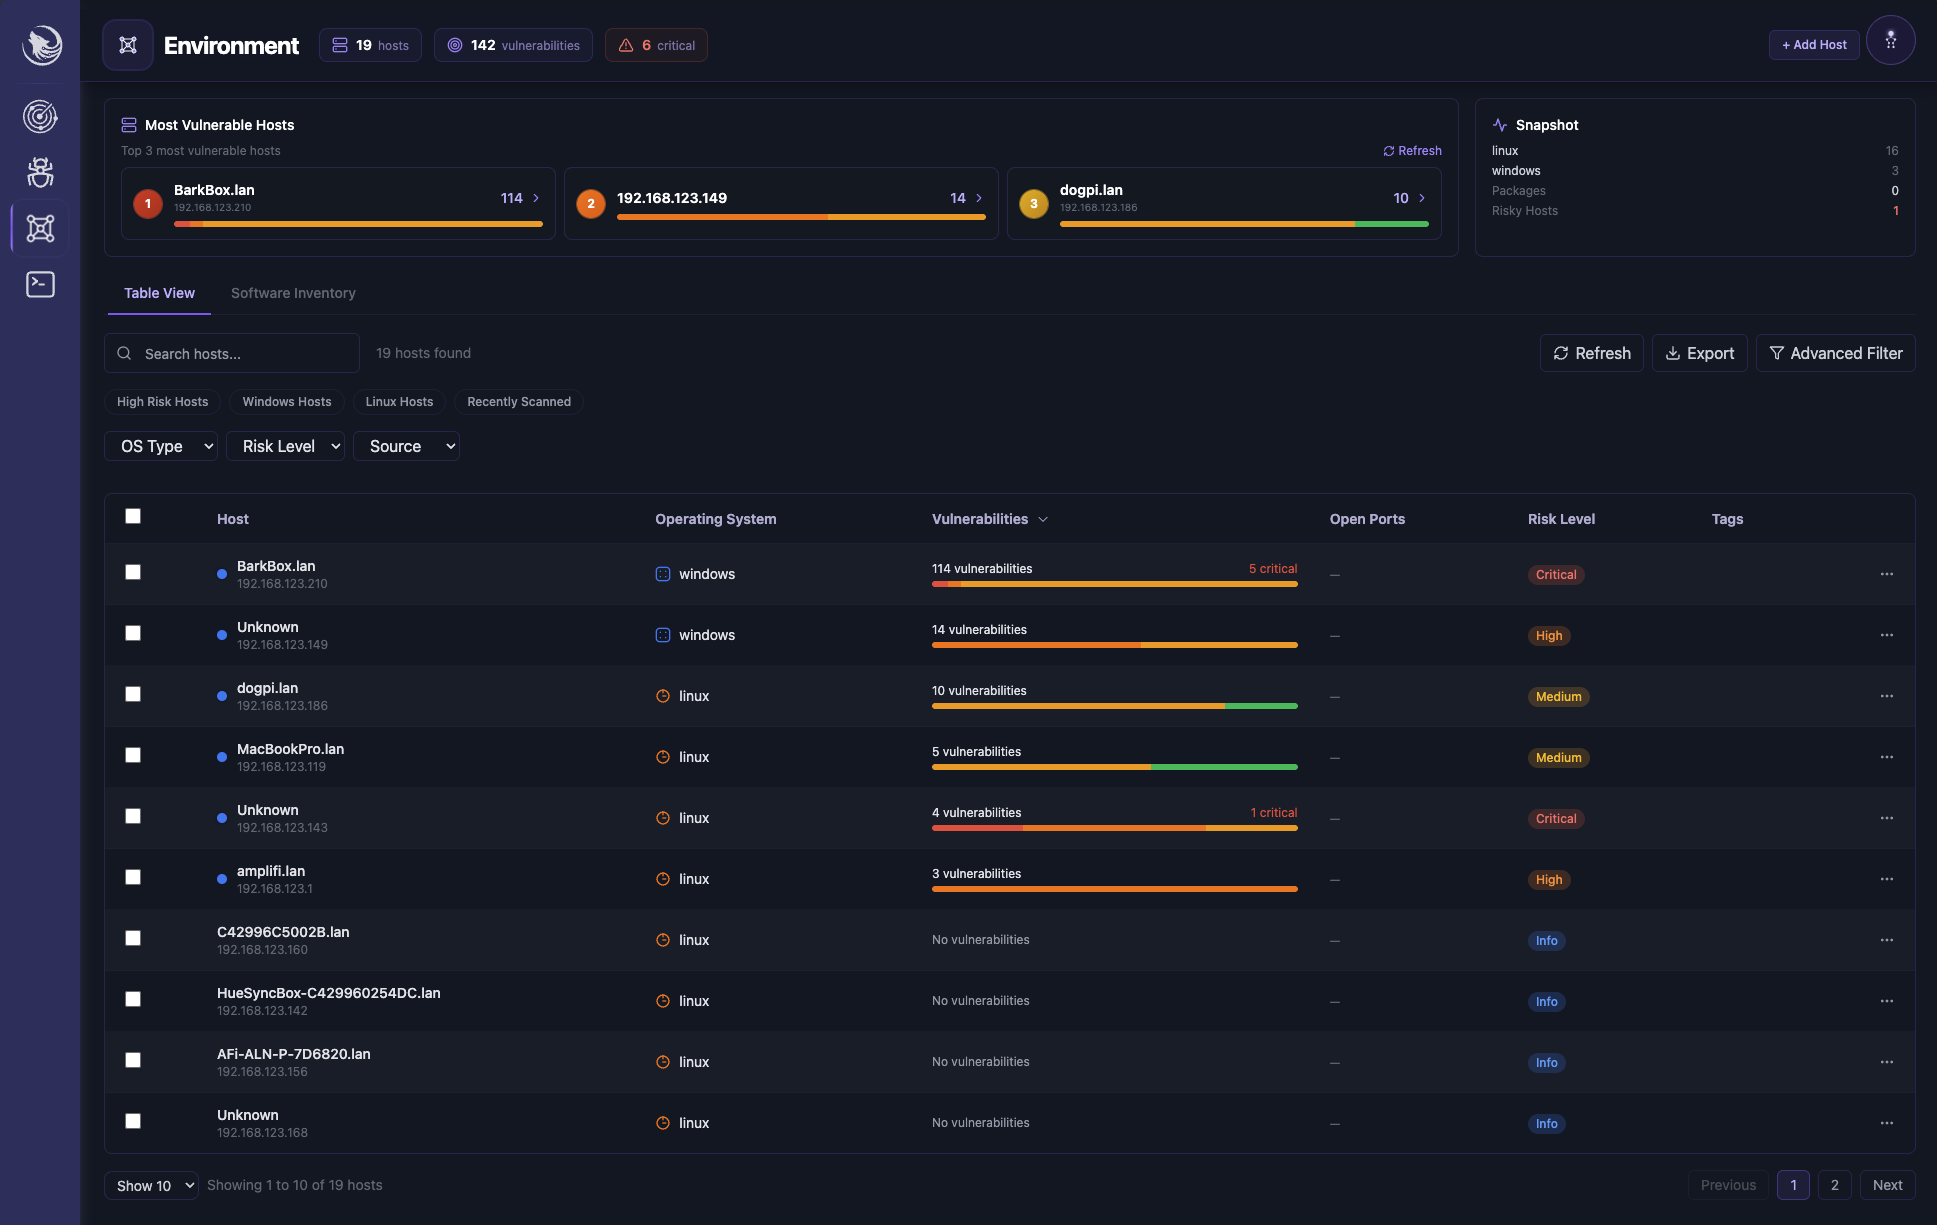
Host Management
- Complete inventory of discovered hosts
- Risk scoring and security metrics per host
- Vulnerability statistics and trending
- Interactive network topology visualization
- Asset categorization and grouping
- Security compliance status tracking
Host Details
The Host Details page provides an in-depth view of individual systems in your environment. When you select a specific host, you'll see a comprehensive breakdown of its security posture, including vulnerability counts, system information, and available services. This interface helps you understand the specific risks and characteristics of each asset in your infrastructure.
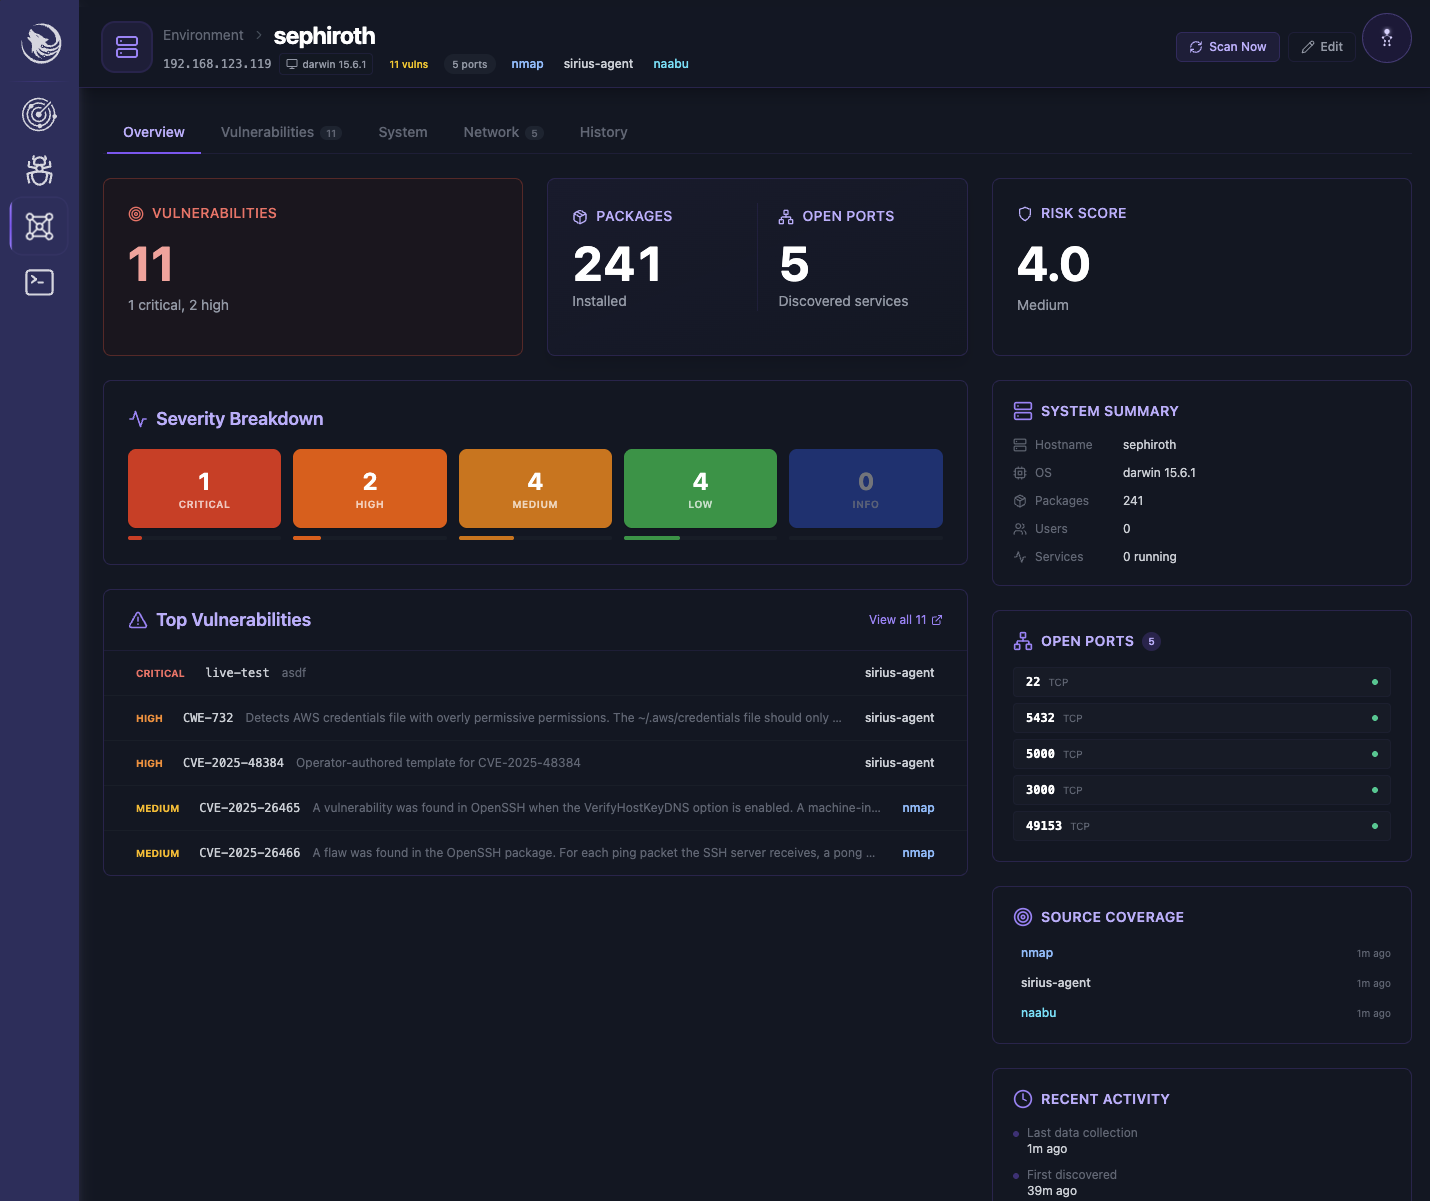
- Detailed system information and specifications
- Complete port and service enumeration
- Vulnerability count by severity level
- Historical scan findings and trends
- System configuration details
- Service version information
- Security risk indicators and metrics
Software Inventory & SBOM
The Software Inventory view gives you package-level insight across your environment and supports SBOM export workflows for downstream compliance and analysis.
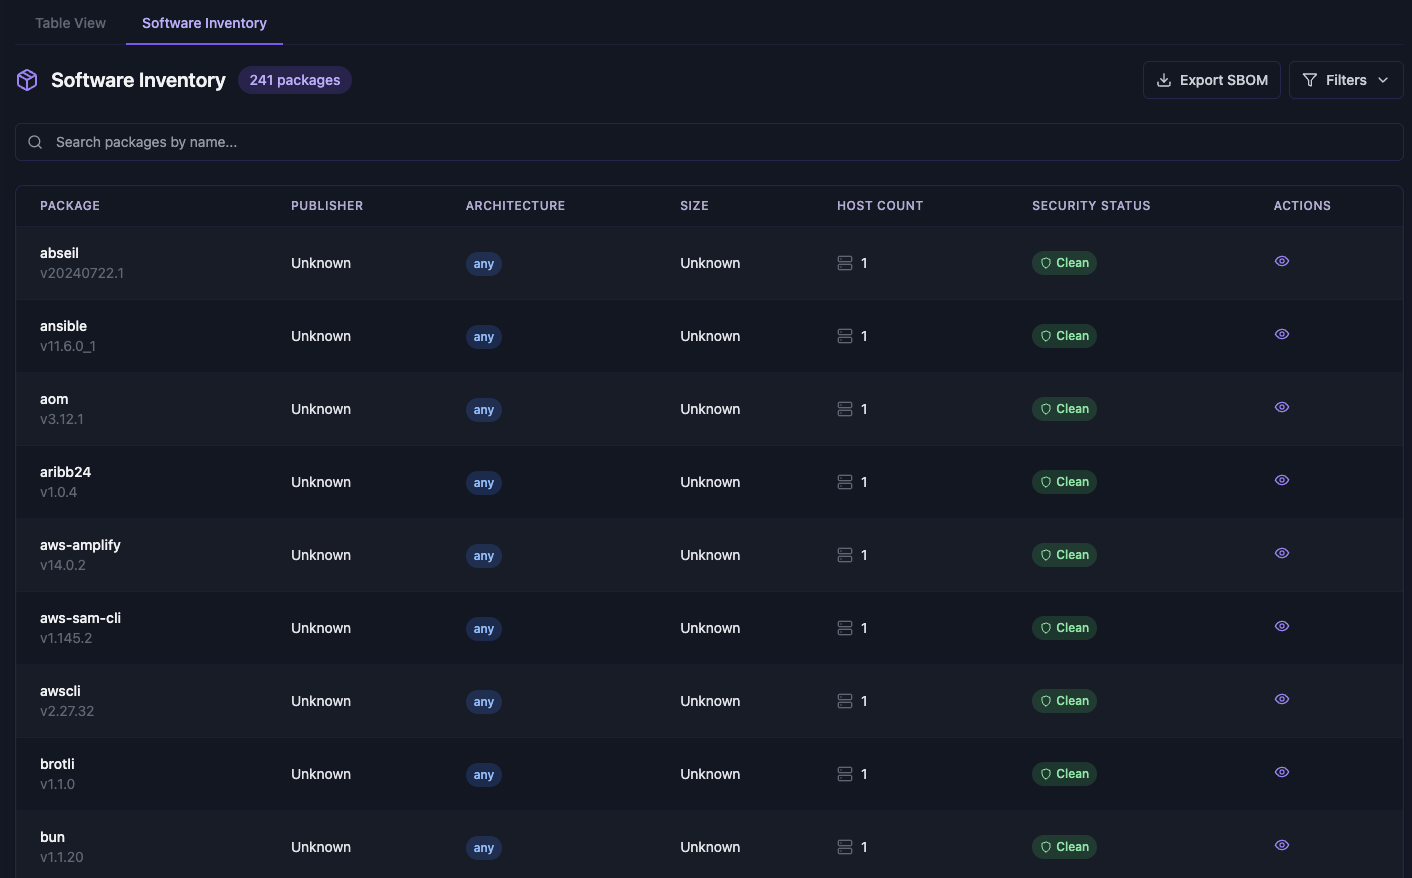
- Package inventory by host and architecture
- Quick security status visibility per package
- Inventory search and filter controls
- Export-ready SBOM workflows
Operator Console
The Operator Console provides direct access to Sirius Scan's backend through terminal execution, history tracking, and agent-aware targeting. This interface is designed for advanced users who need to perform custom operations, automate tasks, and manage distributed agents.
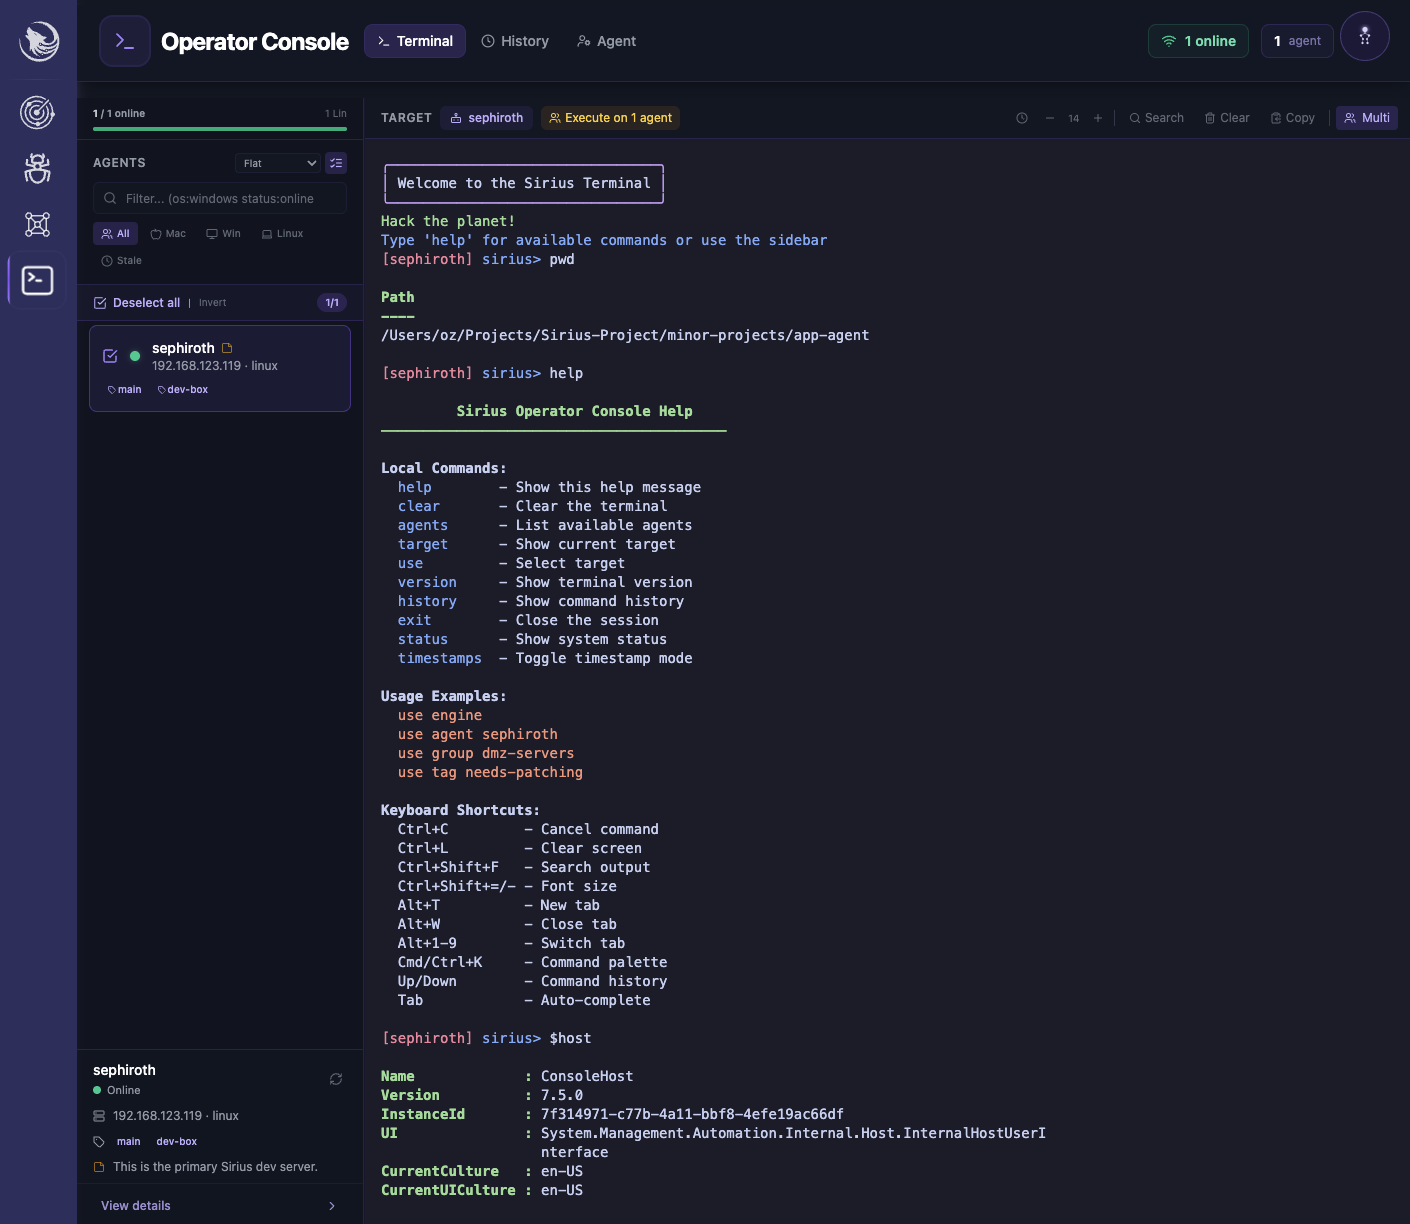
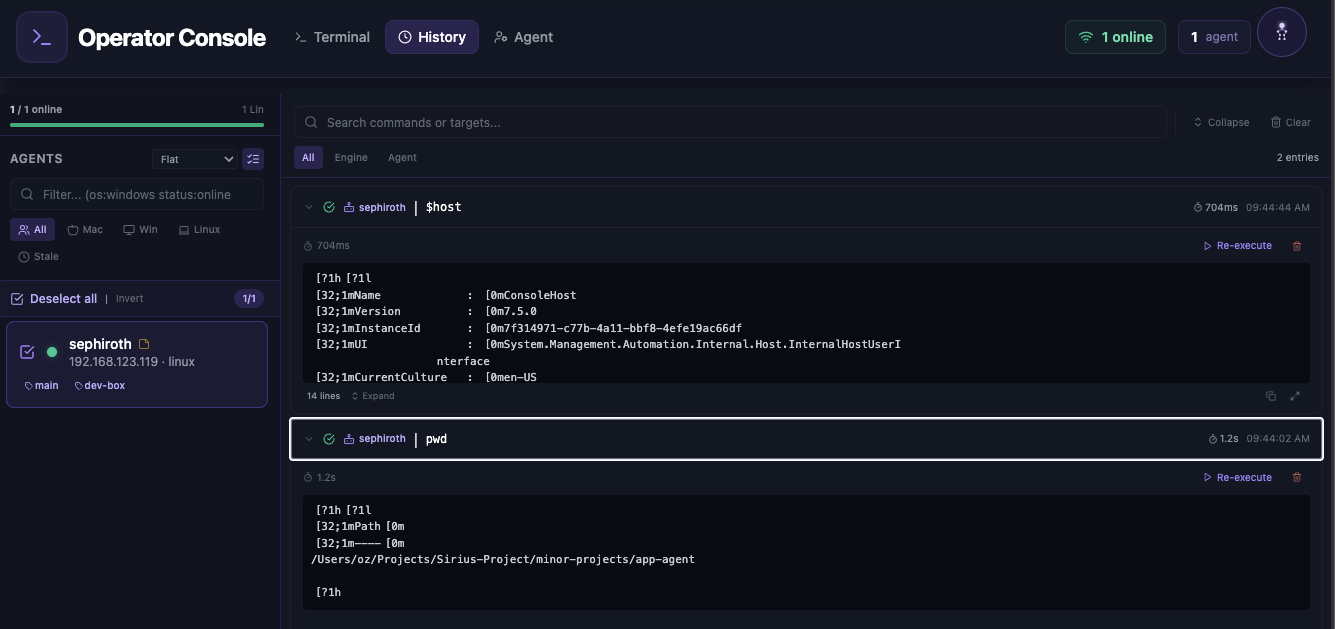
Terminal & History
- Direct command-line access to Sirius backend
- Custom script creation and execution
- Advanced scan configuration options
- System diagnostic capabilities
- Batch operation support
- Output formatting, filtering, and historical replay
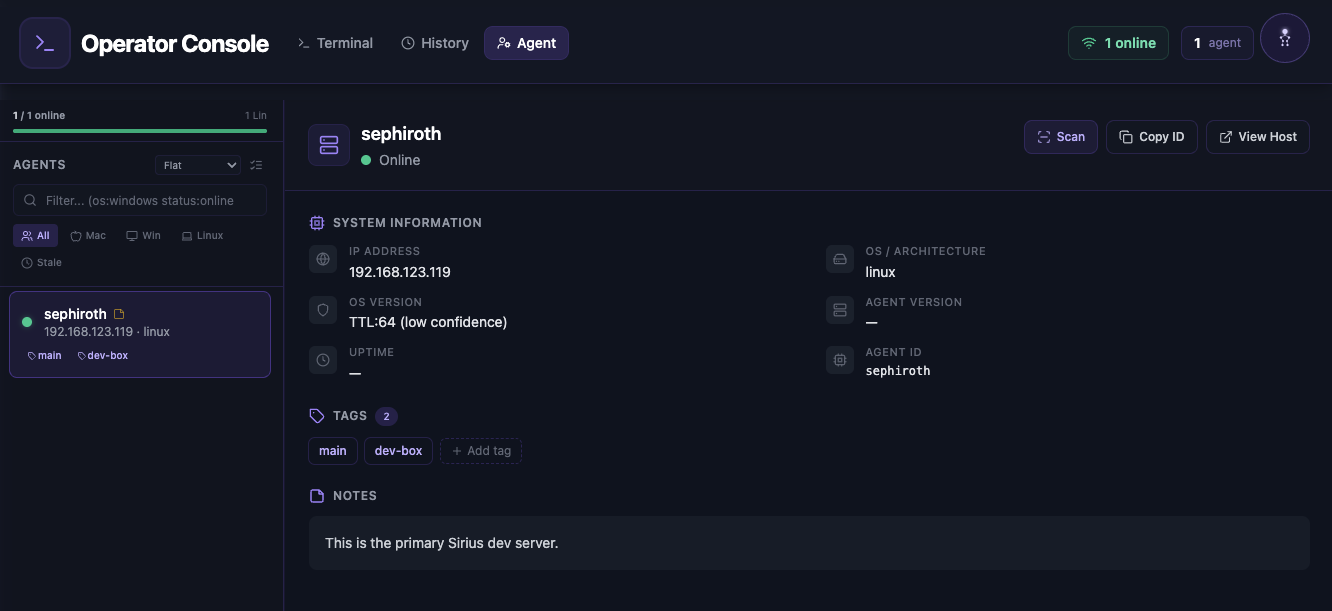
Agent Management
- Centralized agent deployment and control
- Real-time agent health monitoring
- Configuration management for distributed agents
- Agent update and maintenance tools
- Performance metrics and logging
- Remote troubleshooting capabilities
Interface Tips
-
Navigation Shortcuts
- Use keyboard shortcuts for quick access
- Leverage quick filters in list views
- Utilize the global search function
- Pin frequently used views
-
Customization Options
- Adjust dashboard layouts
- Configure default views
- Set up personal preferences
- Create custom report templates
-
Advanced Features
- Use bulk operations for efficiency
- Leverage saved searches
- Create custom dashboards
- Configure automated workflows
Next Steps
- Read about API Integration
- Explore the comprehensive documentation in the main repository
- Join our community discussions for tips and support